Statistics
Vectors to Copenhagen
Vectors to Copenhagen
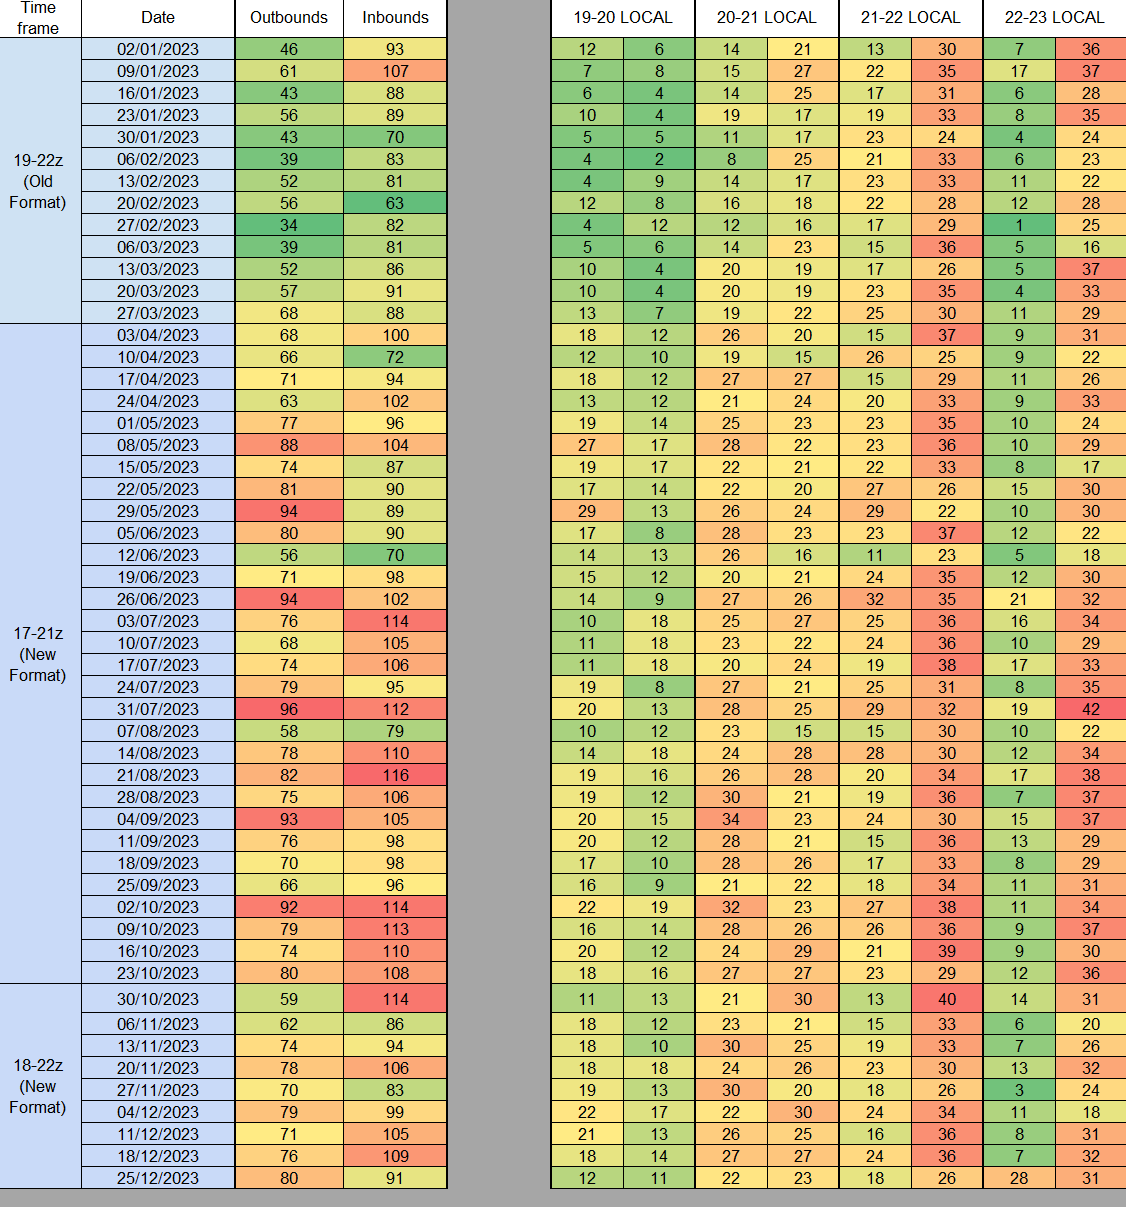
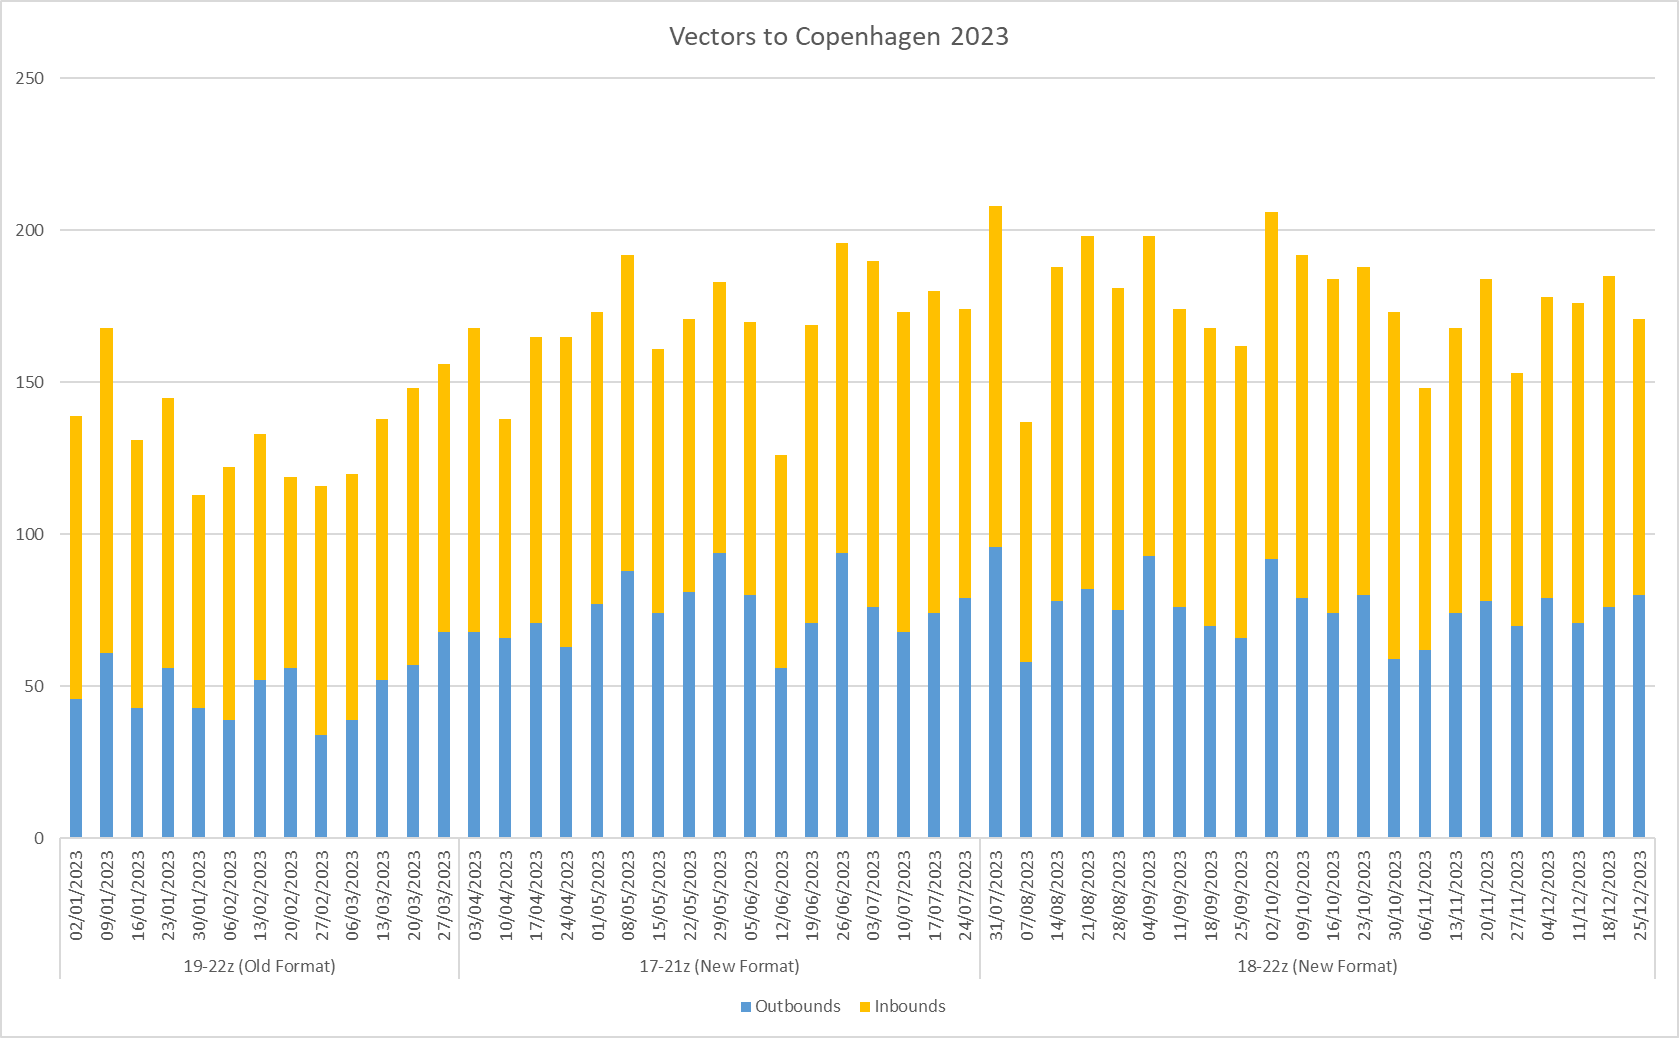
A lot of statistics of VTC needs to be published, so we can see the data of our effort. The year started with the old format, which then moved to the new format. as you see in the long table below consider the following observations
- See the huge difference in traffic numbers between the old and new format (Remember the data shows arrivals in he 17z-22z period regardless). Expanding the event, expanded the traffic.
- You see some huge dips once in a while on an event. Those are the times the event was not published on VATSIM event page, aka. half of our pilots at VTC comes because they are reminded of the event, the other half comes because they know monday is Copenhagen day!
- There is a DIRECT correlation (data not shown) between fitting in A LOT of arrivals in the 21-22 local time window and the amount of traffic landing after 22.30. Therefore... The tighter
athe final and the more traffic we get in in that 21-22 window, the earlier the event finishes. the times of less than 32 arrivals an hourisare often where you see a lot of the arrivals after 22.30. That's why we are adamantonabout less separation on final and effective traffic handling in event times
Table of departures and arrivals and timings
Graph of departures and arrivals
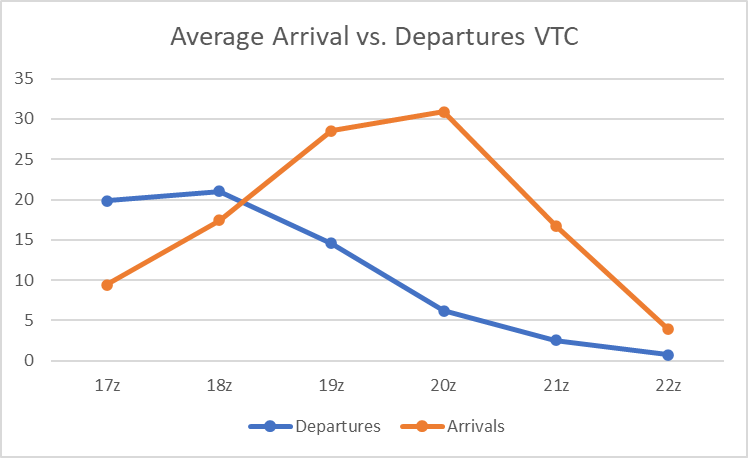
Arrivals and Departures
HopefullyHopefully, nobody will be surprised that MONAK is the most popular inbound routing and NEXEN/LANGO the most popular outbound. Here are the excactexact tables


